asdf
Poverty

Reports
 

LifeSpan Poverty Report CoverThe inability to meet basic needs among older adults is hidden and rarely acknowledged even though a significant number of older adults in the City of Rochester are living in poverty. This report, Poverty in Later Life, summons your attention to the lives of Rochester's older residents who struggle to survive in their 60s, 70s, 80s and 90s. Our intent is not to pit old against young but to cast light on poverty across the lifespan. 

Click on the cover to read the full report .


Hard Facts report cover.jpgIn 2016, ACT Rochester and Rochester Area Community Foundation released an update on the state of poverty and self-sufficiency across the nine-county Greater Rochester region. The report expands the present data on poverty, catalogues the growing community efforts to address it, and adds a perspective on the difference between poverty and self-sufficiency.

Click on the cover to read the full report .


Hard Facts report cover.jpg

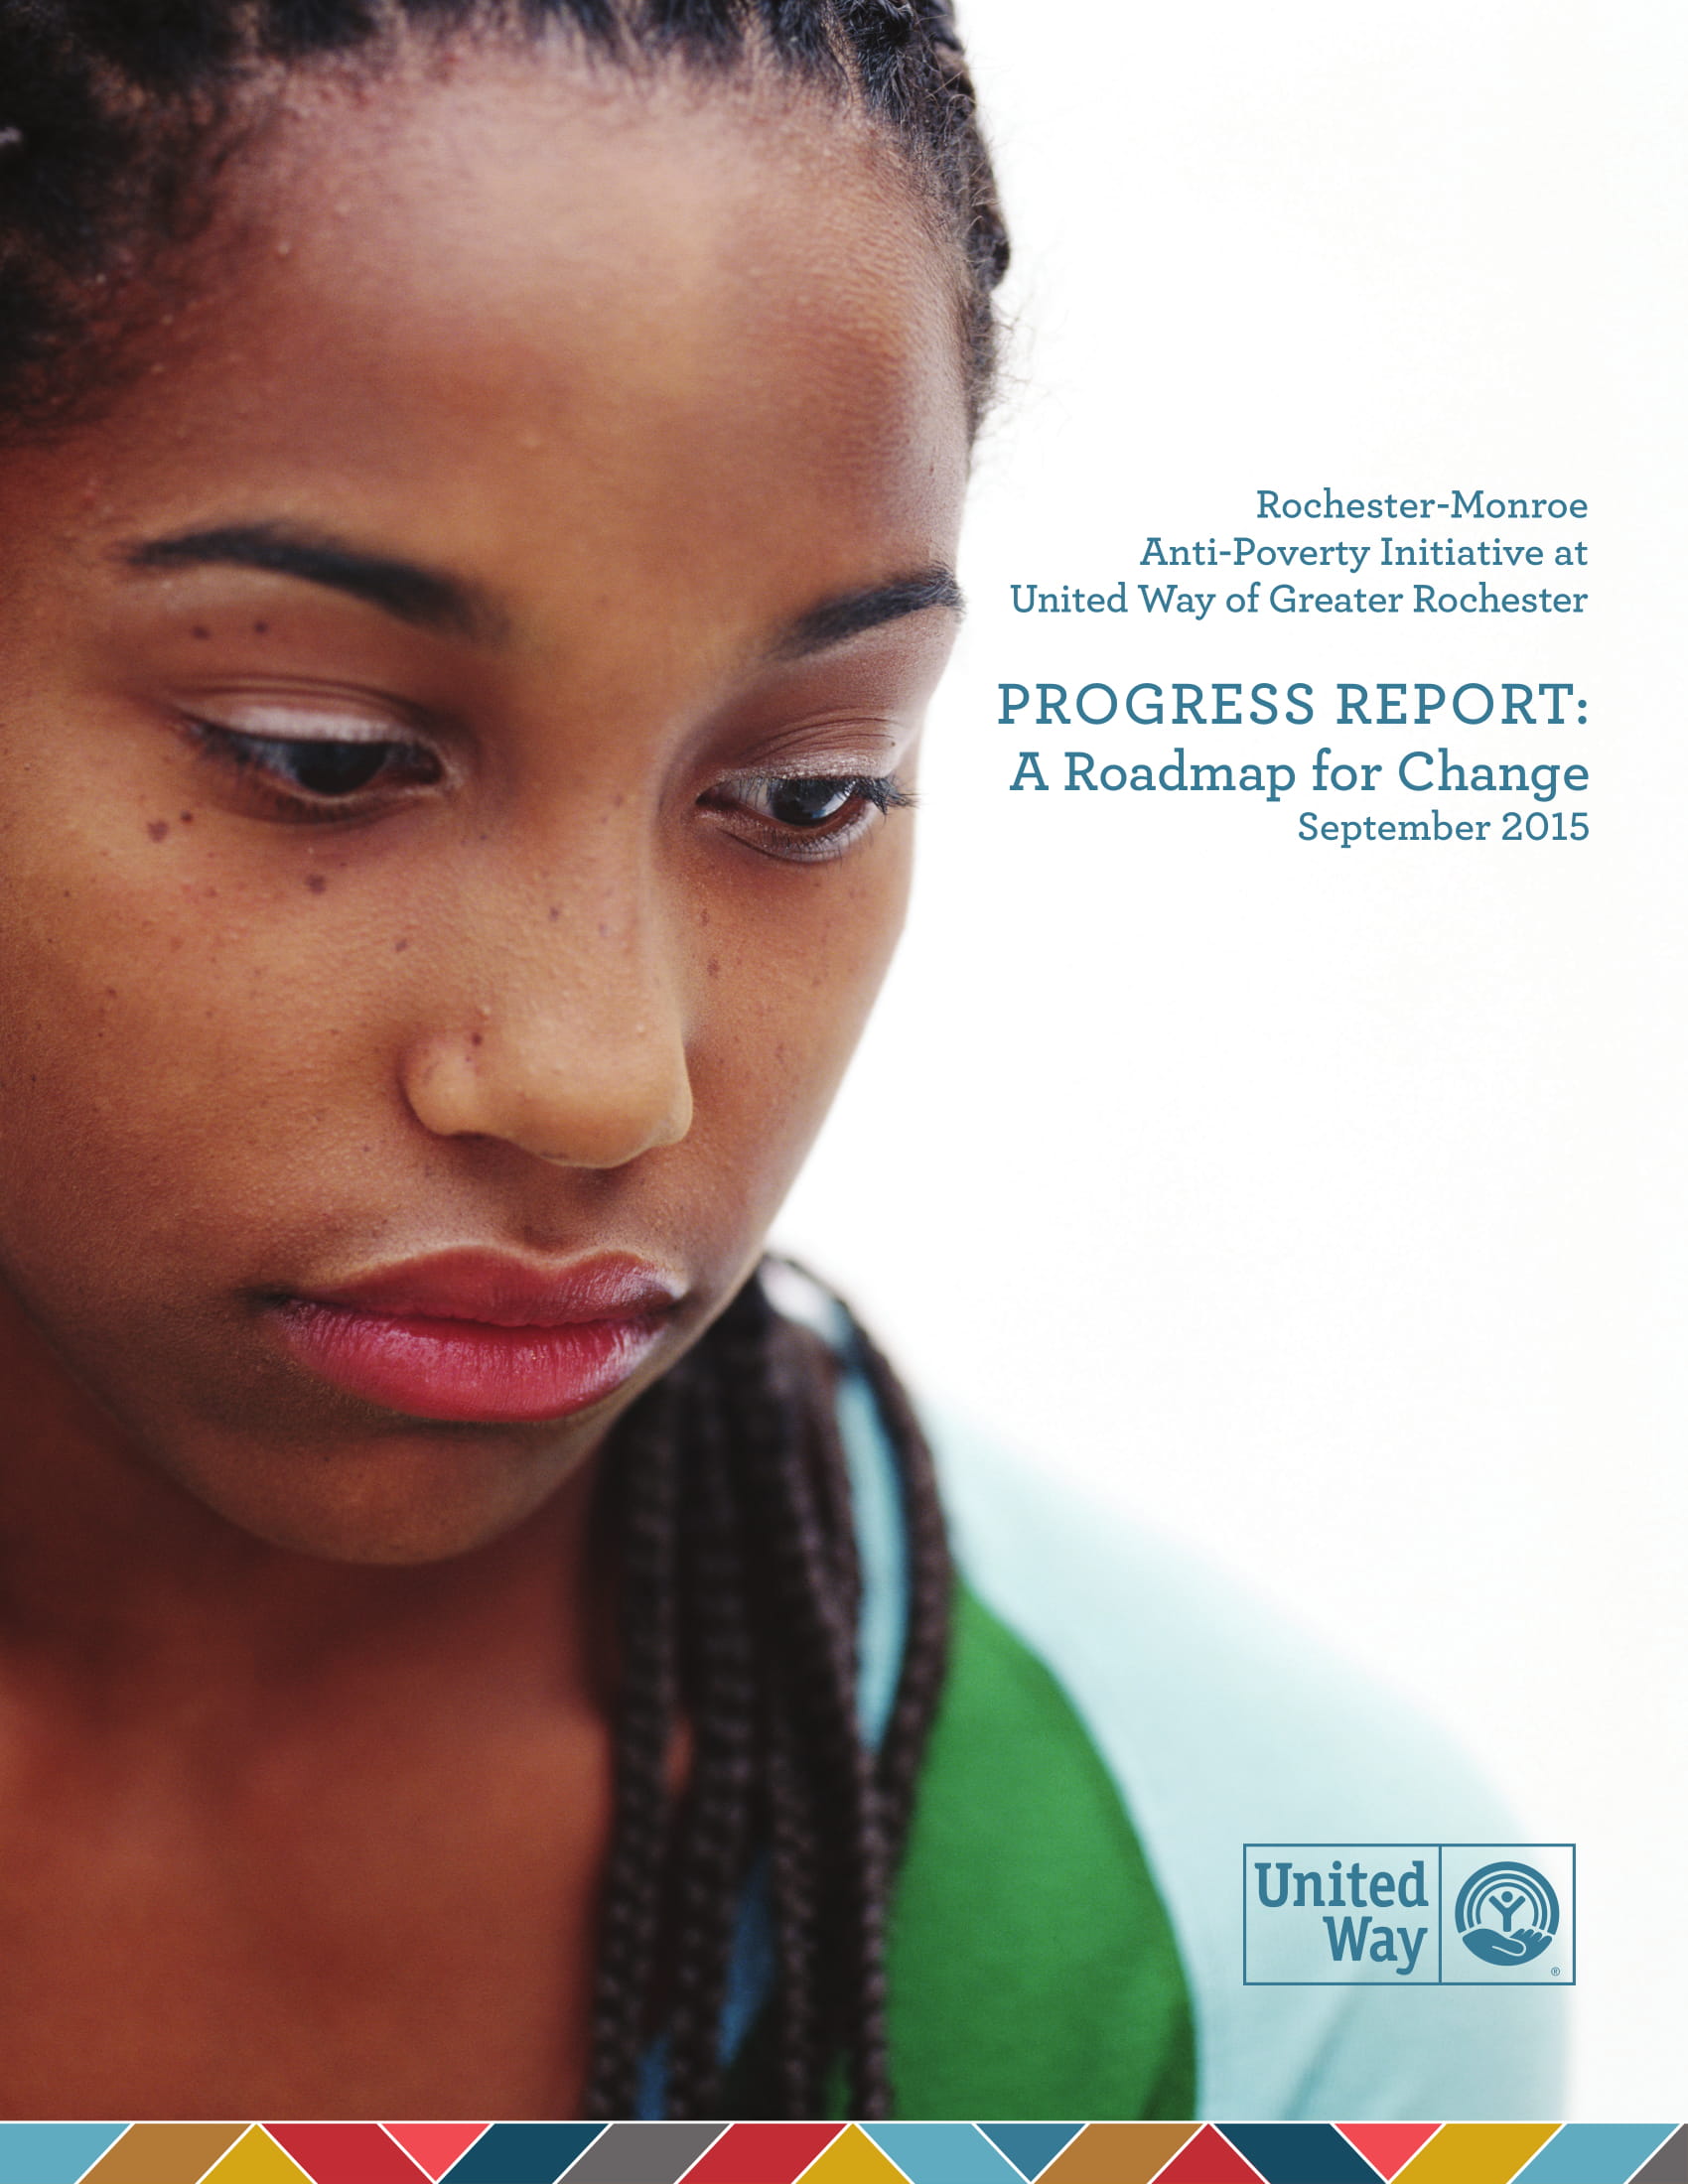
The Rochester-Monroe Anti-Poverty Initiative (RMAPI) is an unprecedented community-wide effort to reduce poverty in the Rochester and Monroe County region by 50 percent over the next 15 years. This initiative involves the efforts and input of nearly 1,000 people in the region,including more than 200 volunteers on committees and workgroups, more than 800 community members who attended a town hall meeting or have participated in surveys, and most importantly, the people this initiative is intended to benefit - individuals impacted by poverty. In September 2015, the Initiative released "Progress Report: A Roadmap for Change". 

Click on the cover to read the full report .


Hard Facts report cover.jpg

The City of Rochester, in partnership with the Rochester-Monroe Anti-Poverty Initiative, is focusing resources to address poverty within a targeted geographic city location, the Pathways to Prosperity District. In collaboration with the Flower City AmeriCorps, the Office of Innovation designed and implemented a door-to-door survey in order to build on previous public outreach efforts and better understand residents’ needs and concerns regarding neighborhood services and employment barriers. More than 400 people were interviewed for this survey, and the results are published in the Pathways to Prosperity Report. The results can also be reviewed through this Interactive Data Dashboard

Click on the cover to read the full report .


Hard Facts report cover.jpg

In January 2015 ACT Rochester and the Community Foundation released a report: Benchmarking Rochester's Poverty: A 2015 Update and Deeper Analysis of Poverty in the City of Rochester as a companion and update to the 2013 Special Report on Poverty. The report also compares poverty data based on gender and race, educational attainment, disability, employment, age, and family size and income.

The concentration of Rochester's Poverty was highlighted in a Century Foundation study out of the Center for Urban Research and Urban Education at Rutgers University. A synopsis of the study is available here.

Click on the cover to read the full report .


2013 Poverty Report cover.jpg


In December 2013 ACT Rochester and the Community Foundation released a Special Report: Poverty and the Concentration of Poverty in the Nine-County Greater Rochester Area. This report became the foundation of much of the work to follow regarding the Rochester-Monroe Anti-Poverty Initiative. The Report found that Rochester is:

  • Fifth poorest city in the country among the top 75 largest metropolitan areas;
  • Second poorest among comparably sized cities in those metro areas;
  • Ranked third for highest concentration of extremely poor neighborhoods among cities in the top 100 metro areas;

The poorest school district in Upstate New York and the poorest urban district in the entire state.

 Click on the cover to read the full report .


Poverty Simulation


This simulation is a highly interactive experience that facilitates awareness of what a typical low-income family experiences in their attempt to survive from month-to-month. Each participant assumes the role of family member living in poverty for one month. The exercise runs for approximately 3 hours, and is coordinated and hosted by CCSI: Coordinated Care Services.  
 
Subscribe to our mailing list to receive notice of the next Poverty Simulation.
 
Check out a video of CCSI's recent workshop!


Worse than NYS by 10% or more
Up to 10% worse than NYS
Equal to or better than NYS


INDICATORS - Grouped by Topic REGIONAL VALUE YEAR NYS COMPARISON TREND | REGION
Prenatal Care 78% 2019 3 1
Increasing
Prenatal Care, by Race/Ethnicity 0 10 Not Applicable*
Babies Born with Low Birth Weights 8.4% 2019 2 1
Increasing
Babies Born with Low Birth Weights, Race/Ethnicity 0 10 Not Applicable*
Infant Mortality Rate 6.9 2017-19 2 0
Maintaining
Infant Mortality Rate, Race/Ethnicity 0 10 Not Applicable*
Children with Elevated Blood Lead Levels 0.8% 2019 2 -1
Decreasing
Children in Poverty 18% 2017-21 3 1
Increasing
Children in Poverty, Race/Ethnicity 2017-21 0 10 Not Applicable*
Single-Parent Families 39% 2017-21 2 1
Increasing
Single-Parent Families, by Race/Ethnicity 2017-21 0 10 Not Applicable*
Rate of Child Abuse and Neglect 20 2020 2 1
Increasing
Rate of Foster Care Admissions 1.8 2020 2 -1
Decreasing
Rate of Teen Pregnancy 1.3% 2019 3 -1
Decreasing
Rate of Teen Births 12 2019 2 -1
Decreasing
Tourism Spending $1,399 2021 1 0
Maintaining
Recreation Spending $83 2021 1 -1
Decreasing
Voter Registration Rate 84% 2021 2 1
Increasing
Voter Participation Rate 64% 2020 3 1
Increasing
Registered Library Borrowers 55% 2020 3 -1
Decreasing
Library Visits 2.5 2020 3 -1
Decreasing
Charitable Contributions as a Percentage of Income 0.8% 2020 2 -1
Decreasing
Households Without Vehicles 10% 2017-21 3 0
Maintaining
Total Population 1.4% 2021 2 1
Increasing
Means of Transportation to Work 2017-21 0 10 Not Applicable*
Population by Age 2017-21 0 10 Not Applicable*
Workers’ Commute Time, by Means of Transportation to Work 2017-21 0 10 Not Applicable*
Population by Race/Ethnicity 2017-21 0 10 Not Applicable*
Crashes Involving Pedestrians 2.6 2022 3 0
Maintaining
Population by Age and Race/Ethnicity 2017-21 0 10 Not Applicable*
Crashes Involving Cyclists 1.4 2022 3 -1
Decreasing
Disengaged Youth, Ages 16 to 19 6% 2017-21 3 -1
Decreasing
Vehicle Crashes Resulting in Injuries and Fatalities 60 2022 3 -1
Decreasing
Median Household Income $64,995 2017-21 1 -1
Decreasing
Vehicle Miles Traveled (VMT) 24 2022 2 -1
Decreasing
Median Household Income, by Race/Ethnicity 2017-21 0 10 Not Applicable*
Miles of Dedicated Bike Infrastructure 2023 0 10 Not Applicable*
People Living in Poverty 13% 2017-21 3 1
Increasing
RTS Ridership 8 2022 0 -1
Decreasing
People Living in Poverty, by Race/Ethnicity 2017-21 0 10 Not Applicable*
People Living in Poverty, by Sex 2017-21 0 10 Not Applicable*
RTS On-time Performance 0 10 Not Applicable*
Greenhouse Gas Emissions 23.7 2018 0 10 Not Applicable*
Public Assistance Recipients 1.2% 2021 3 -1
Decreasing
Energy Burden of Households 0 10 Not Applicable*
Approval Rate for Public Assistance Applications 22% 2021 0 -1
Decreasing
Females Living in Poverty, by Race/Ethnicity 2017-21 0 10 Not Applicable*
Solar Energy Capacity 122.8 2022 3 1
Increasing
Seniors Living in Poverty, by Sex 2017-21 0 10 Not Applicable*
Households Receiving SNAP 13% 2017-21 3 -1
Decreasing
Households Receiving SNAP by Race/Ethnicity 2017-21 0 10 Not Applicable*
Female Seniors Living in Poverty, by Race/Ethnicity 2017-21 0 10 Not Applicable*
Gas Usage for Household Heating 74% 2017-21 1 -1
Decreasing
Clean Energy Workforce 4.7% 2021 3 1
Increasing
Tax Filers Receiving Earned Income Tax Credit 14% 2020 3 -1
Decreasing
Clean Energy Communities 2023 0 10 Not Applicable*
EITC Dollars $153 2020 2 -1
Decreasing
Electric Vehicles (EV) Charging Ports 165 2023 0 -1
Decreasing
Change in Total Jobs 2.3% 2021 2 1
Increasing
Asthma Hospitalizations 0 10 Not Applicable*
Change in Number of Business Establishments by Sector 2021 0 10 Not Applicable*
Food Deserts 35% 2019 1 10 Not Applicable*
Change in Jobs by Sector 2021 0 10 Not Applicable*
Food Deserts in Low-Income Areas 20% 2019 1 10 Not Applicable*
Sector Shares of Regional Total Employment 2021 0 10 Not Applicable*
Unemployment Rate 4.9% 2021 3 1
Increasing
Unemployment Rate by Race/Ethnicity 2017-21 0 10 Not Applicable*
Average Salary by Sector 2021 0 10 Not Applicable*
Change in Average Salary Since 2000 12% 2021 3 1
Increasing
Change in Average Salary Since 2000 by Sector 2021 0 10 Not Applicable*
Employment-to-Population Ratio 59% 2017-21 3 -1
Decreasing
Prekindergarten Participation 41% 2021 2 1
Increasing
School Spending Per Student $23,561 2020 1 1
Increasing
Instructional Spending Per Student $16,983 2020 1 1
Increasing
Students Receiving Special Education Services 2021 0 -1
Decreasing
Grade 3 English 37% 2022 2 1
Increasing
Grade 3 English by Student Subgroup 2022 0 10 Not Applicable*
Grade 3 English by Race/Ethnicity 2022 0 10 Not Applicable*
Grade 3 Math 40% 2022 2 1
Increasing
Grade 3 Math by Student Subgroup 2022 0 10 Not Applicable*
Grade 3 Math by Race/Ethnicity 2022 0 10 Not Applicable*
Grade 8 English 39% 2019 2 1
Increasing
Grade 8 English by Student Subgroup 2019 0 10 Not Applicable*
Grade 8 English by Race/Ethnicity 2019 0 10 Not Applicable*
Grade 8 Math 49% 2019 2 1
Increasing
Regents Algebra 1 73% 2019 3 1
Increasing
Regents English 83% 2019 2 1
Increasing
Four-Year Cohort Graduation Rate 88% 2022 3 1
Increasing
Cohort Graduation Rate, Beyond Four Years 90% 2022 3 1
Increasing
Four-Year Cohort Graduation Rate by Race/Ethnicity 2022 0 10 Not Applicable*
Education Levels of Adults 2017-21 0 10 Not Applicable*
Education Levels of Adults by Race/Ethnicity 2017-21 0 10 Not Applicable*
People Without Health Insurance 5% 2020 3 -1
Decreasing
Supply of Doctors 35.3 2019 1 1
Increasing
Mortality Rate 693 2019 1 -1
Decreasing
Chlamydia Rate 53 2020 2 1
Increasing
Chlamydia Rates, Race/Ethnicity, Monroe County 0 10 Not Applicable*
Gonorrhea Rate 37 2020 1 1
Increasing
Maternal Health, by Race/Ethnicity 2018-20 0 10 Not Applicable*
Gonorrhea Rates, Race/Ethnicity, Monroe County 0 10 Not Applicable*
Early Syphilis Rates 2.8 2020 3 1
Increasing
Early Syphilis Rates within Monroe County, by Race/Ethnicity 0 10 Not Applicable*
People Living with HIV 105 2021 0 1
Increasing
People Living with HIV by Race/Ethnicity 2021 0 10 Not Applicable*
People Living with AIDS 124 2021 0 1
Increasing
People Living with AIDS by Race/Ethnicity 2021 0 10 Not Applicable*
Percent of Days with Good Air Quality 0 10 Not Applicable*
Alcohol-related Crashes 2.7 2021 2 -1
Decreasing
Admissions to Substance Abuse Treatment by Primary Substance 2021 0 10 Not Applicable*
Median Home Value $151,405 2017-21 1 1
Increasing
Median Rental Prices $936 2017-21 3 -1
Decreasing
Housing Affordability for Homeowners 2.3 2017-21 3 0
Maintaining
Housing Affordability for Homeowners by Race/Ethnicity 2017-21 0 10 Not Applicable*
Overall Housing Cost Burden 28% 2017-21 3 -1
Decreasing
Housing Affordability for Renters 32% 2017-21 3 10 Not Applicable*
Rent Burdened Households 48% 2017-21 3 -1
Decreasing
Housing Affordability for Renters by Race/Ethnicity 2017-21 0 10 Not Applicable*
Homeownership Rate 68% 2017-21 3 -1
Decreasing
Homeownership Rate by Race/Ethnicity 2017-21 0 10 Not Applicable*
Vacant Housing Units 9% 2017-21 3 1
Increasing
Homeless Persons 0 10 Not Applicable*
Serious Crimes 165 2021 3 -1
Decreasing
Violent Crimes 25 2021 3 1
Increasing
Victims of Domestic Violence 59 2021 0 -1
Decreasing
Incarceration Rates 10.0 2021 0 -1
Decreasing
Incarceration Rates, by Race/Ethnicity 2018 0 10 Not Applicable*
Arrest Rates 125.2 2021 3 -1
Decreasing
Arrest Rates, by Race/Ethnicity 2021 0 10 Not Applicable*
Per-Capita Spending for Local Government $3,731 2019 0 1
Increasing
Female to Male Earnings Ratio 0.70 2017-21 3 0
Maintaining
*No or multiple regional values for this indicator


Worse than NYS by 10% or more
Up to 10% worse than NYS
Equal to or better than NYS


Loading...